DevTools/Planning/Performance/Details
Performance Overview
To optimize the performance of an html5 and JS based web application, we need two general pieces of information, each of which requires slightly different tooling, or a universal tool that can do both:
1) What's slowing down execution
What it really comes down to is how well the application responds and flows. So we are basically looking for slowdowns in frame rates and looking for the root causes of those slow downs. Those root causes generally come from three sources:
- a) Excessive DOM and graphical changes coming from JS execution
- b) Excessive DOM and graphical changes coming from unoptimized HTML5 and CSS
- c) Unoptimized JS code itself, i.e. the code just takes too long to run
- d) Unoptimized JS execution (baseline versus ionmonkey)
- e) Unoptimized garbage collection: if we keep releasing a lot of objects, GC will run more frequently
The right tooling will instrument as lightly as possible in order to minimize impact on performance and will provide a time-based view of execution. Mostly, as a developer, I want to find out where my application is slowing down (frame rate) and why (where is my application spending time when the frame rate slows down.)
2) What's increasing memory consumption
When the browser was king, web apps could run on desktops and laptops where memory was really not much of a consideration, especially when it came to writing client-side apps. But with the proliferation of mobile devices and the push towards cheaper devices, memory is a premium and can no longer be taken for granted. Hence there is a need for tools that can tell us about our application's memory consumption and clues on how to minimize it.
In general, optimizing memory is really about counting object instances. There are several different types of memory optimizations that need to be done:
- Short term memory leaks (Google calls this "scattered objects" or "Action cleanness".)
- DOM Leaks, i.e. Orphaned DOM fragments that keep increasing after specific events
- Long term memory leaks, i.e. less obvious leaks that take 5 minutes or more to increase to a measurable level.
- Overall memory footprint reduction - an app. may not have any "leaks" but may still be a glutton for memory.
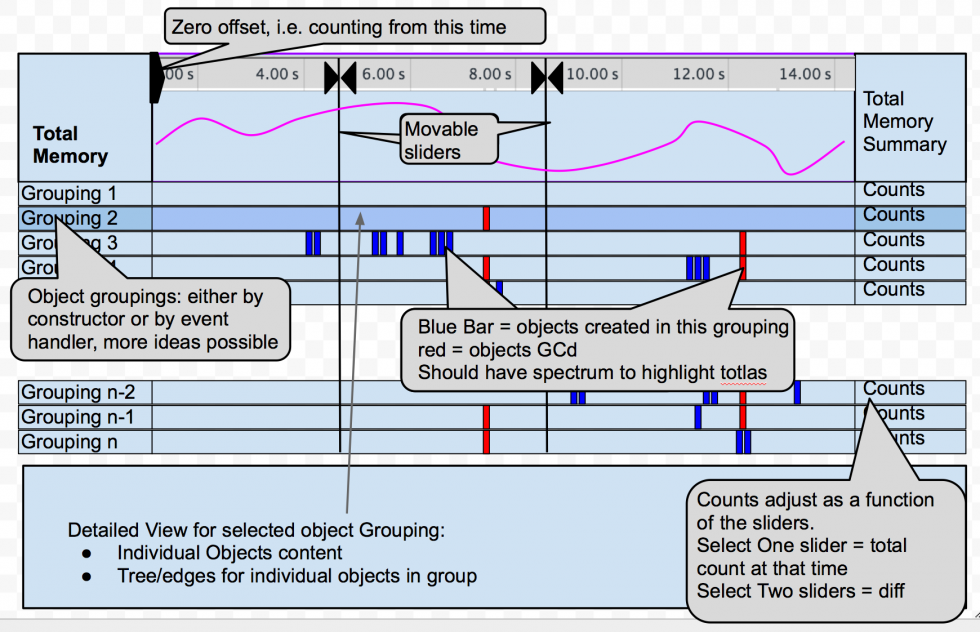
Here is an example of a memory leak timeline design that would allow exploring for memory leaks:
That's about it, and it should not be more complicated than that.
Product Design Challenges
Memory and frame rates go hand in hand - the former can significantly impact the latter in memory-restricted environments. So this begs the question of how to integrate both memory and frame rare into a unified tool set that runs seamlessly. Here we lay out some design patterns that should be considered and incorporated into the whole design of the tools.
Product Design Patterns
1) Flame Charting
Flame charts are intuitive ways of representing both time-based and memory-based recordings and for representing live memory feedback. there should be a unified way to navigate across flame charts and clicking through the elements.
2) Cycling between live visualization and recording mode
In order to find problems, engineers need to be able to interact with their applications. It's not easy to go back into a recording and find problems if you forgot what you did when you recorded. So there is a need to provide live feedback, allow for a deeper dive, and, finally perhaps to pass over and record with deeper instrumentation. One possible concept is to allow for a combo live feedback and keep at least 15 seconds of recording in memory so that if the user sees a problem, he can hit a sort of "pause" button that would allow him to look at the last 15 seconds and see more details. Of course, this is not an issue while actually recording, but live feedback should always come with at least 5-15 seconds of "buffer" so that one can go back and look at what happened when say live frame rate feedback suggests a slow down.
3) One single recording tool as opposed to distinct recording tools
Does a developer really need to figure out whether to do a "timeline" or a "CPU profile" or a "whatever profile?". Isn't it enough to have one recording UI that provides a container for any "type" of recording? In reality, there is only one recording but with different depths of instrumentation. This does pose a challenge: how to have a combined temporal and memory based view. My gut tells me this is doable, we will just need to find an easy, user friendly way of doing it.
4) Changing sampling/instrumentation depth
Design pattern 3) drives the need for being able to change the sampling/instrumentation depth. We have one recording, with multiple instrumentation depths possible.
5) Record/snapshot in one UI element
A camera now days can take photos or videos. In this case, it's no different. We either record, or we can just take snapshots and compare. The user should still be able to be in the same UI.
6) Movable snapshots
Design pattern 5) drives the need for supporting snapshot bars, i.e. movable line along the time dimension that can allow one to do diffs across a recording and compare object counts, or, if snapshots are all that is available, the snapshots still show up as lines in a time dimension and can be selected to do diffs.
7) key shortcut bookmark
While recording, it might be useful for engineers to be able to hit a shortcut key that will put a "mark" or a snapshot line into a recording to serve as bookmarks for example for a a before/after UI interaction bookmarking.
